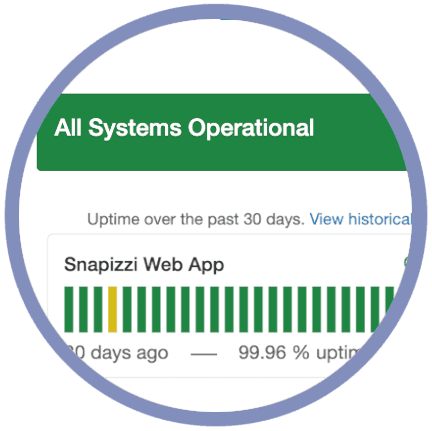


Publishing, syncing, and managing thousands of photographs depends on reliable cloud services. When questions arise about performance, it's important to know whether the issue is isolated to your project or part of broader system activity.
The Dashboard Indicator and Server Status Page provide immediate visibility into Snapizzi's current operating status, helping photographers quickly understand overall system health before beginning more detailed troubleshooting.
The Dashboard Indicator gives you a quick visual reference to Snapizzi's current server activity.
Rather than wondering whether temporary slowdowns are related to your project or the platform itself, you can immediately see the current system status directly from your Dashboard.
While the indicator provides a general view of server activity, it is not intended to represent precise utilization percentages or performance metrics.
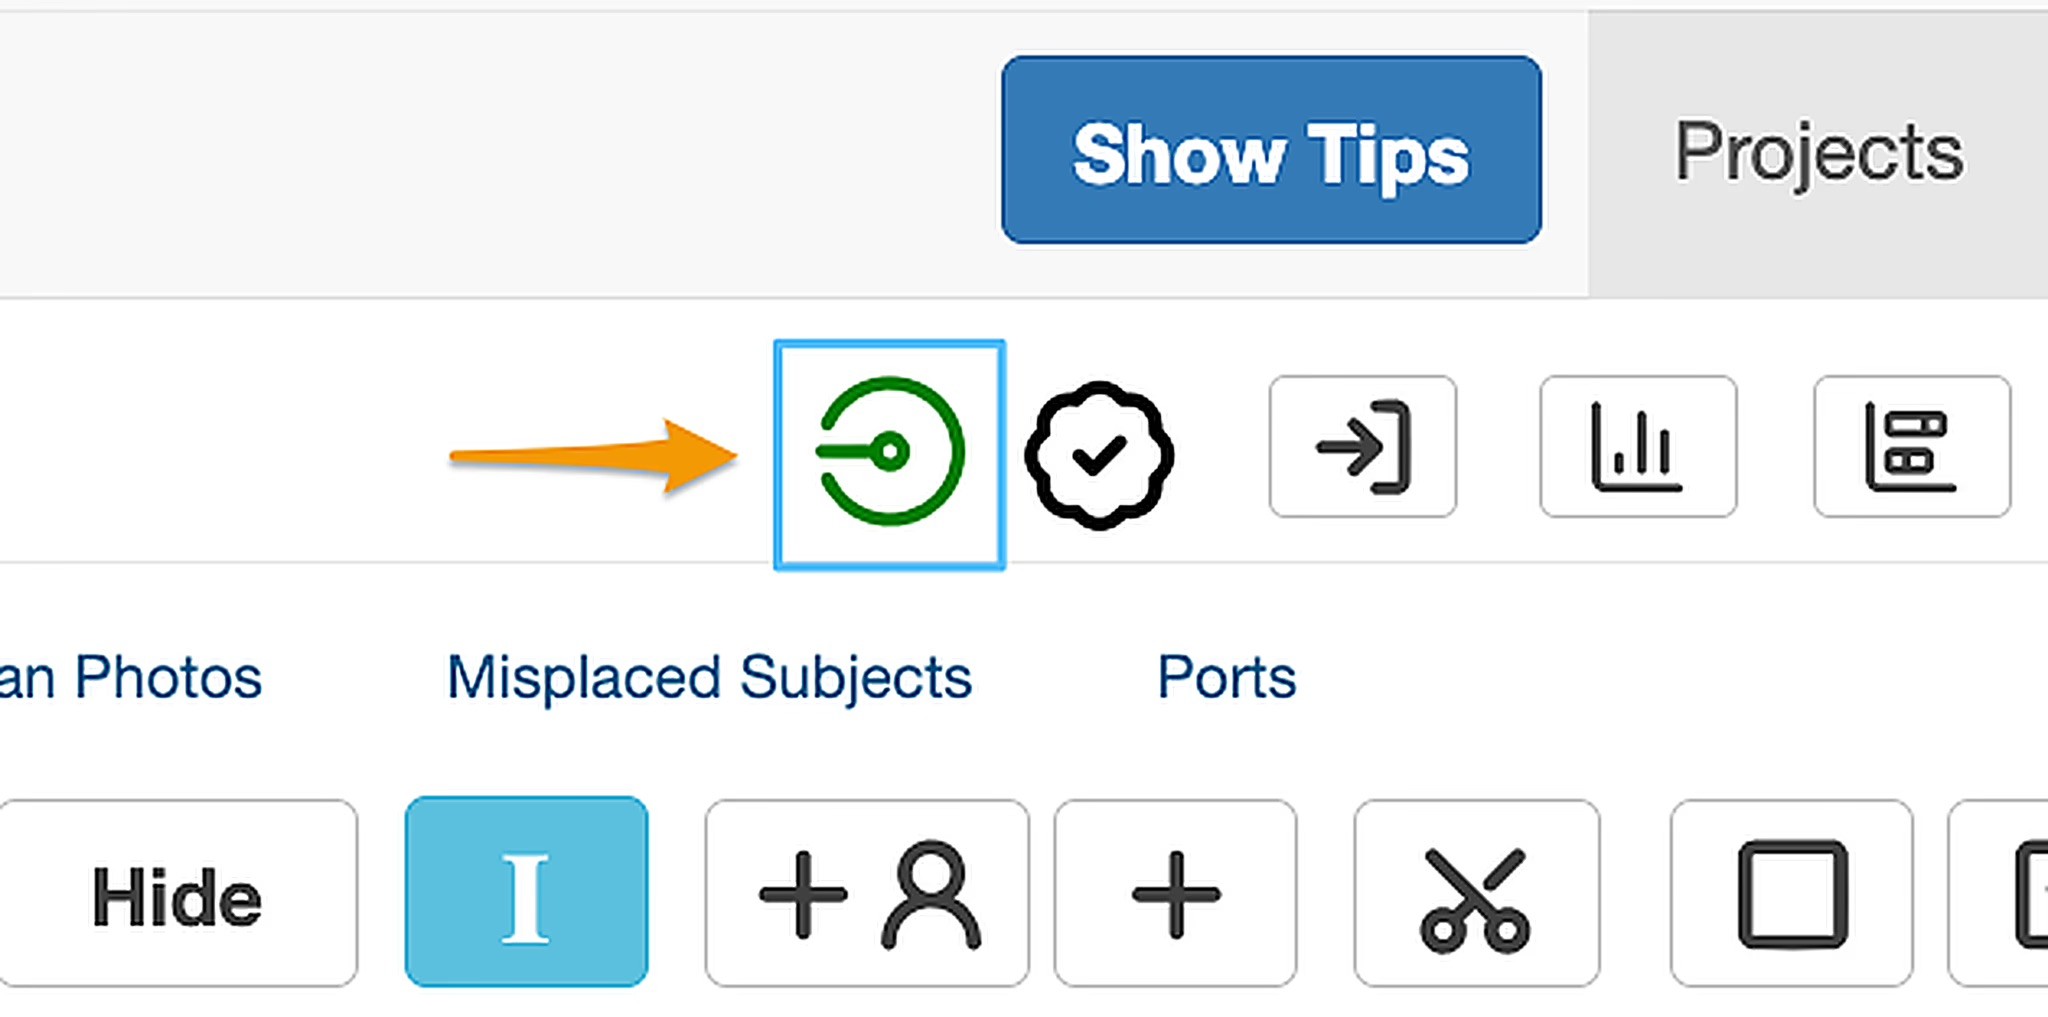
Understand Snapizzi’s five activity colors and check service status when you need more information.
When you’re uploading, processing, or publishing a large photography project, a delay can raise questions. Is Snapizzi especially busy? Is there a reported service disruption? Does a particular project need attention?
The Dashboard Indicator and Server Status Page give you useful starting points. Together, they help you understand overall server activity and check for reported service issues.
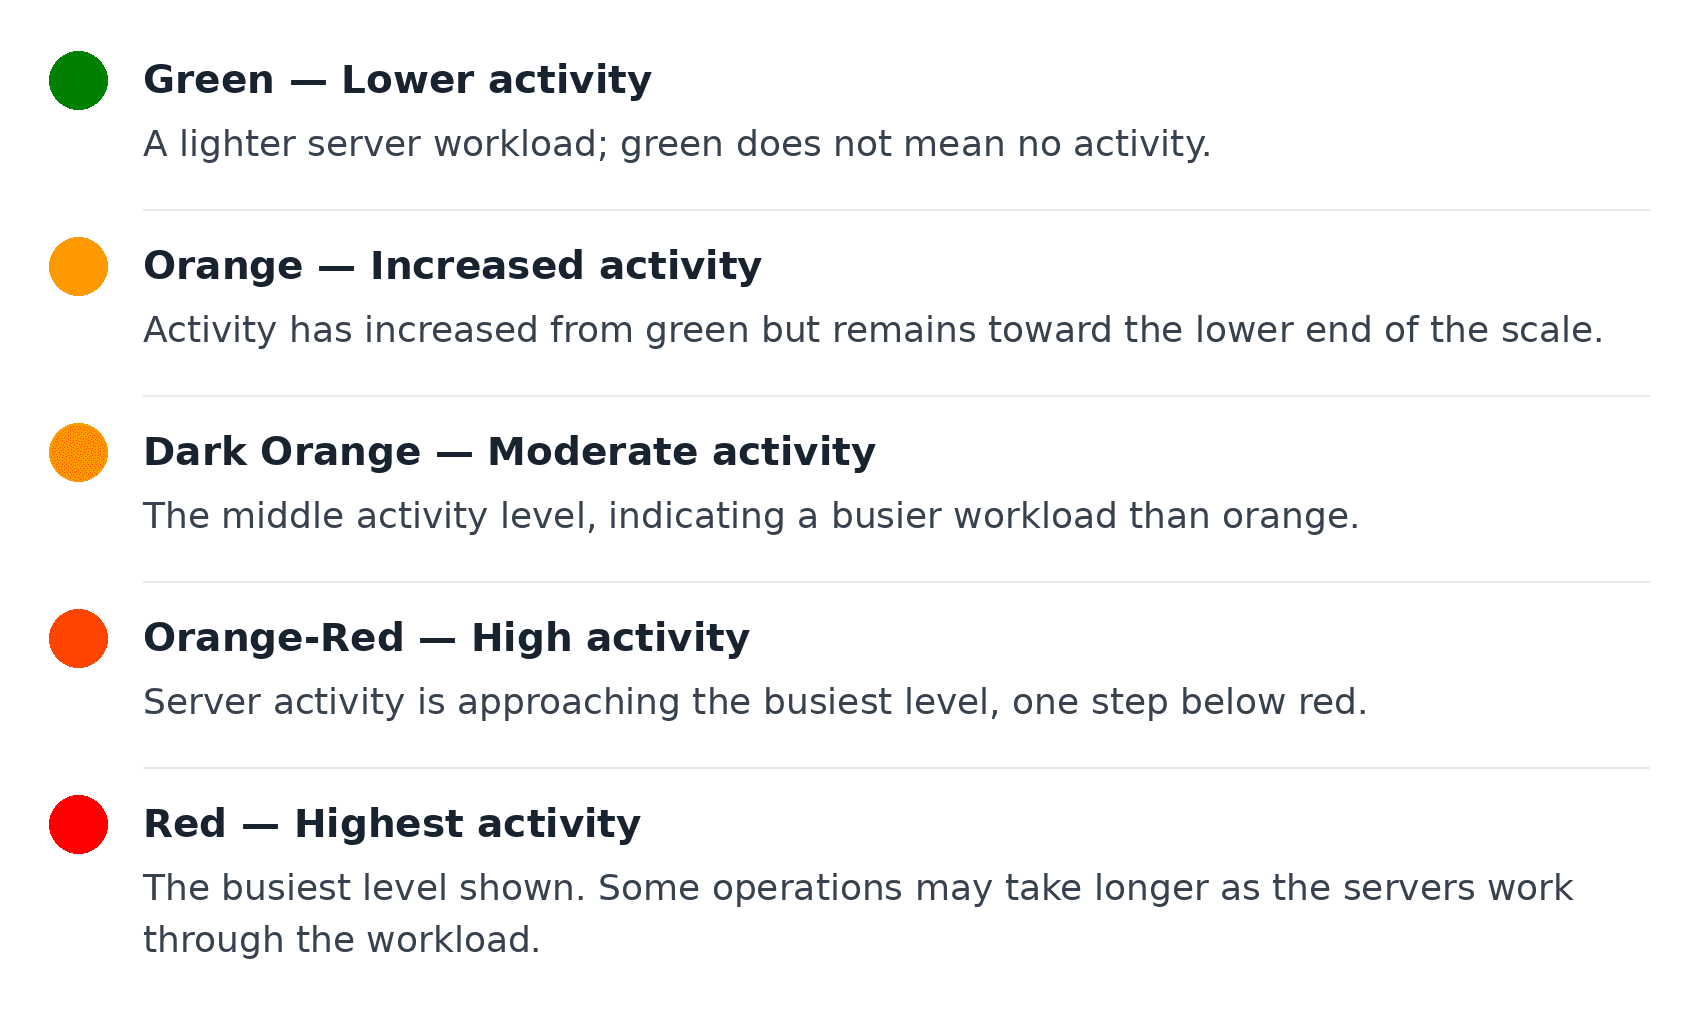
The Dashboard Indicator uses five colors to show increasing levels of overall server activity:
Know the status of Snapizzi services before you start troubleshooting.
For additional information, photographers can open the Server Status Page to review:
Current service availability
Scheduled maintenance
Incident reports
Recent system history
This provides greater transparency whenever maintenance or unexpected service interruptions occur.
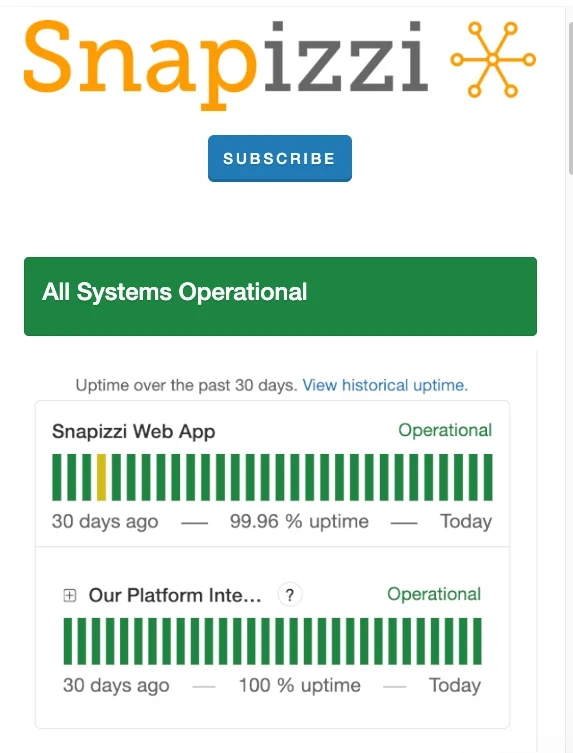
Knowing the current status of Snapizzi services helps photographers make informed troubleshooting decisions.
If the Dashboard Indicator and Server Status Page show normal operation, you can focus on diagnosing your own project using tools such as the Diagnose & Remedy Tool, Activity Log, or Remote Gallery Health Report.
If a broader platform issue is affecting service, you'll know immediately without spending unnecessary time investigating your own workflow.
Large photography projects often involve thousands of images, multiple uploads, and continuous synchronization with connected gallery platforms.
Having immediate visibility into platform status helps photographers work more confidently during busy production periods while reducing uncertainty whenever processing times temporarily increase.
The Dashboard Indicator and Server Status Page complement Snapizzi's growing collection of workflow monitoring tools.
Together with the Diagnose & Remedy Tool, Activity Log, and Remote Gallery Health Report, they provide greater transparency throughout every stage of the photography workflow—from project creation to final gallery delivery.
We're always looking for ways to improve Snapizzi. If you have feedback or questions, we'd love to hear from you.
Note: This article was originally published when the Dashboard Indicator and Server Status Page were introduced. It has been updated to reflect the current Snapizzi platform while preserving the historical context of the original announcement.
Related Articles
Explore more features, announcements, and workflow improvements.
Related Help Articles
Step-by-step guides and documentation from the Snapizzi Knowledge Base.
Explore These Topics
Find more articles on the topics covered in this post.
Continue Exploring Snapizzi
Content Directory — Browse all articles and workflow resources
Release History — Explore new features and product updates
Knowledge Base — Find tutorials and documentation
User Love — See what photographers say about Snapizzi